End to End Data Science Project


This article is meant to show you through the major steps I used in completing an end to end Machine learning project. The project I will be working on is the Prediction of diabetic patients You can get the dataset from Here
Dataset Description
VARIABLE NAMES: DESCRIPTION
Encounter ID: Unique identifier of an encounter
Patient number: Unique identifier of a patient
Race Values: Caucasian, Asian, African American, Hispanic, and other
Gender Values: male, female, and unknown/invalid
Age: Grouped in 10-year intervals: 0, 10), 10, 20), …, 90, 100)
Weight: Weight in pounds
Admission type: Integer identifier corresponding to 9 distinct values, for example, emergency, urgent, elective, newborn, and not available
Discharge disposition: Integer identifier corresponding to 29 distinct values, for example, discharged to home, expired, and not available
Admission source: Integer identifier corresponding to 21 distinct values, for example, physician referral, emergency room, and transfer from a hospital
Time in hospital: Integer number of days between admission and discharge
Payer code: Integer identifier corresponding to 23 distinct values, for example, Blue Cross/Blue Shield, Medicare, and self-pay Medical
Medical speciality: Integer identifier of a speciality of the admitting physician, corresponding to 84 distinct values, for example, cardiology, internal medicine, family/general practice, and surgeon
Number of lab procedures: Number of lab tests performed during the encounter
Number of procedures: Numeric Number of procedures (other than lab tests) performed during the encounter
Number of medications: Number of distinct generic names administered during the encounter
Number of outpatient visits: Number of outpatient visits of the patient in the year preceding the encounter
Number of emergency: visits Number of emergency visits of the patient in the year preceding the encounter
Number of inpatient visits: Number of inpatient visits of the patient in the year preceding the encounter
Diagnosis 1: The primary diagnosis (coded as first three digits of ICD9); 848 distinct values
Diagnosis 2: Secondary diagnosis (coded as first three digits of ICD9); 923 distinct values
Diagnosis 3: Additional secondary diagnosis (coded as first three digits of ICD9); 954 distinct values
Number of diagnoses: entered to the system 0%
Glucose serum test result: Indicates the range of the result or if the test was not taken. Values: “>200,” “>300,” “normal,” and “none” if not measured
A1c test result: Indicates the range of the result or if the test was not taken. Values: “>8” if the result was greater than 8%, “>7” if the result was greater than 7% but less than 8%, “normal” if the result was less than 7%, and “none” if not measured.
Change of medications: Indicates if there was a change in diabetic medications (either dosage or generic name). Values: “change” and “no change”
Diabetes medications: Indicates if there was any diabetic medication prescribed. Values: “yes” and “no”
24 features for medications For the generic names: metformin, repaglinide, nateglinide, chlorpropamide, glimepiride, acetohexamide, glipizide, glyburide,tolbutamide, pioglitazone, rosiglitazone, acarbose, miglitol, troglitazone, tolazamide, examide, sitagliptin, insulin, glyburide-metformin, glipizide-metformin, glimepiride- pioglitazone, metformin-rosiglitazone, and metformin- pioglitazone, the feature indicates whether the drug was prescribed or there was a change in the dosage. Values: “up” if the dosage was increased during the encounter, “down” if the dosage was decreased, “steady” if the dosage did not change, and “no” if the drug was not prescribed
Readmitted: Days to inpatient readmission. Values: “30” if the patient was readmitted in more than 30 days, and “No” for no record of readmission.
Steps taken
Problem definition: Understanding the project objectives and requirements from a domain perspective and then converting this knowledge into a data science problem definition with a preliminary plan designed to achieve the objectives.
Hospital readmission is when a patient who is discharged from the hospital, gets re-admitted again within a certain period of time. Hospital readmission rates for certain conditions are now considered an indicator of hospital quality, and also affect the cost of care adversely. For this reason, Centers for Medicare & Medicaid Services established the Hospital Readmissions Reduction Program which aims to improve quality of care for patients and reduce health care spending by applying payment penalties to hospitals that have more than expected readmission rates for certain conditions. Although diabetes is not yet included in the penalty measures, the program is regularly adding new disease conditions to the list, now totalling 6 for FY2018. In 2011, American hospitals spent over $41 billion on diabetic patients who got readmitted within 30 days of discharge. Being able to determine factors that lead to higher readmission in such patients, and correspondingly being able to predict which patients will get readmitted can help hospitals save millions of dollars while improving quality of care. So, with that background in mind, we used a medical claims dataset (description below), to answer the question: What factors are the strongest predictors of hospital readmission in diabetic patients? Given these predictors, can we predict if a diabetic patient will be readmitted?
Getting the dataset: Without training datasets, machine-learning algorithms would have no way of learning how to do text mining, text classification or categorize, you can get your datasets from web scrapping, and download from a public repository like Kaggle, UCI machine learning repository. Got mine from UCI machine repository.
Exploratory data analysis: Exploratory Data Analysis (EDA), also known as Data Exploration, is a step in the Data Analysis Process, where a number of techniques are used to better understand the dataset being used.
The main purpose of EDA is: Understanding your variables: You don’t know what you don’t know. And if you don’t know what you don’t know, then how are you supposed to know whether your insights make sense or not? You won’t.
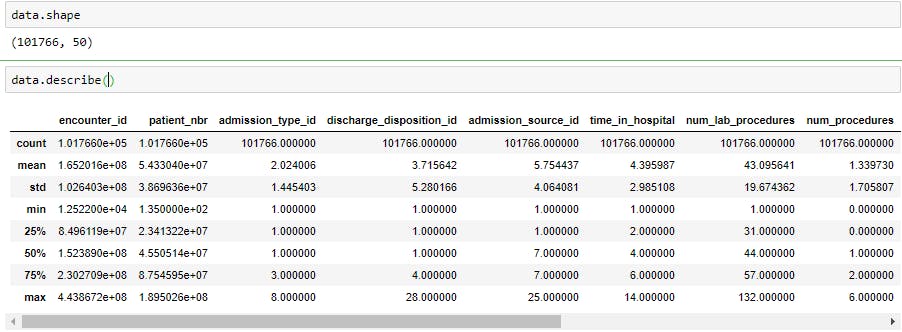
.shape returns the number of rows by the number of columns for my dataset. My output was (525839, 22), meaning the dataset has 525839 rows and 22 columns.
.head() returns the first 5 rows of my dataset. This is useful if you want to see some example values for each variable.
.columns returns the name of all of your columns in the dataset. Once I knew all of the variables in the dataset, I wanted to get a better understanding of the different values for each variable.
df.nunique returns the number of unique values for each variable.
.describe() summarizes the count, mean, standard deviation, min, and max for numeric variables. The code that follows this simply formats each row to the regular format and suppresses scientific notation (see here). Cleaning your dataset: cleaning your dataset involves removing redundant variables, variable selection, removing outliers. Analyzing relationships between variables: Use correlation matrix, scatterplot, and histogram to analyze the relationship between features
 ![image.png]
(cdn.hashnode.com/res/hashnode/image/upload/..)
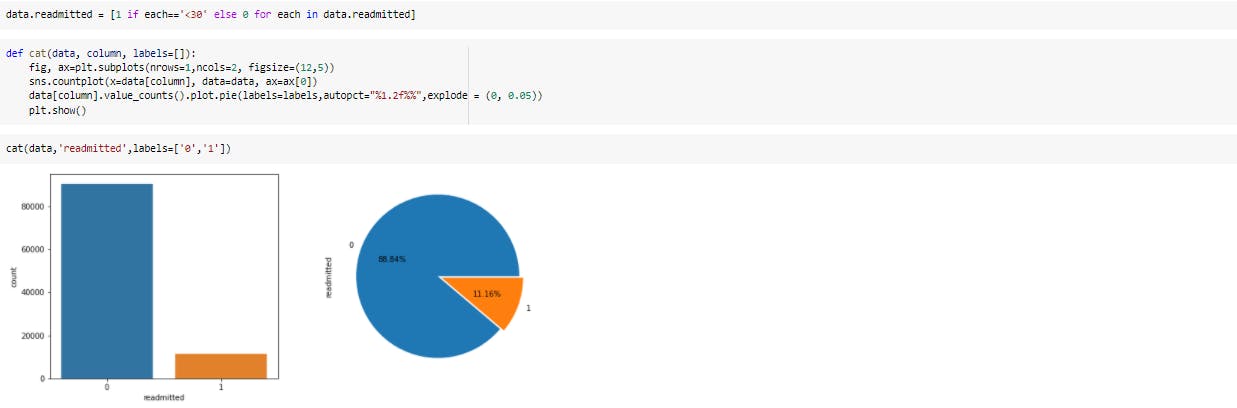
Visualizing the target variable
![image.png]
(cdn.hashnode.com/res/hashnode/image/upload/..)
Visualizing the target variable
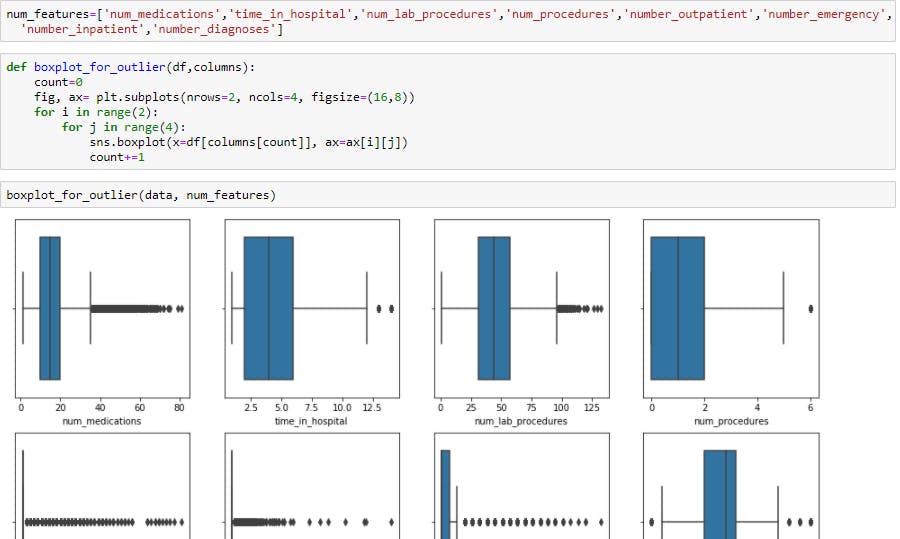
 Checking for outliers using box plots.
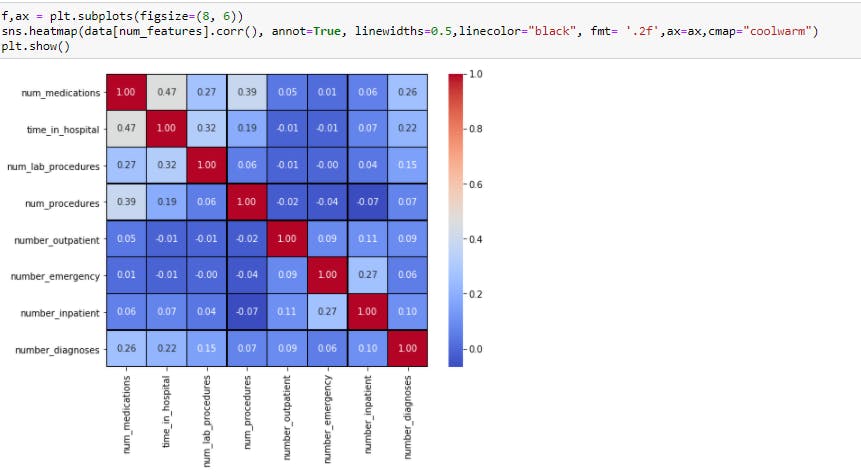
 Check for correlation
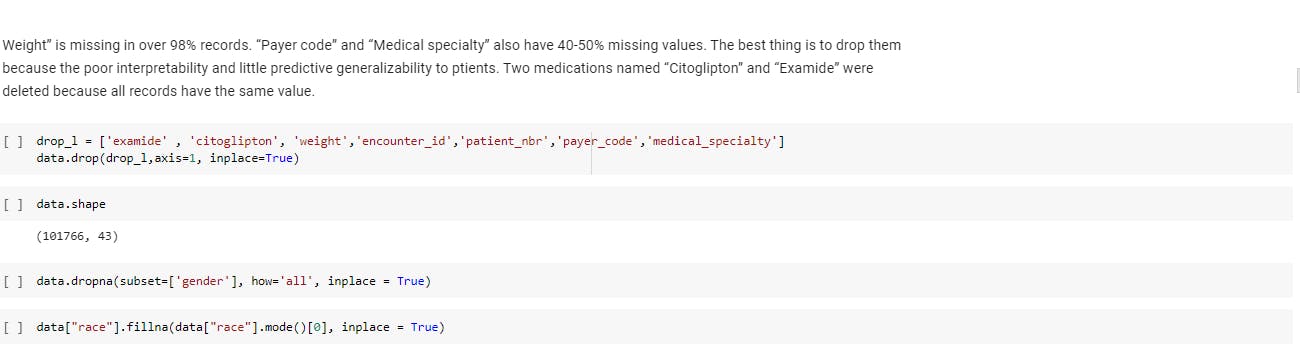
Dealing with the missing Values: Real-world data often has missing values. Data can have missing values for a number of reasons such as observations that were not recorded and data corruption. Handling missing data is important as many machine learning algorithms do not support data with missing values. Various methods to deal with missing values are: Remove Rows With Missing Values Impute Missing Values with mean, median or mode. Impute with a constant value that has meaning within the domain, such as 0, distinct from all other values. Impute with the value from another randomly selected record. Impute with a value estimated by another predictive model.
check for the missing values and impute them

Feature extraction: Feature extraction increases the accuracy of learned models by extracting features from the input data. This phase of the general framework reduces the dimensionality of data by removing the redundant data. Of course, it increases training and inference speed.
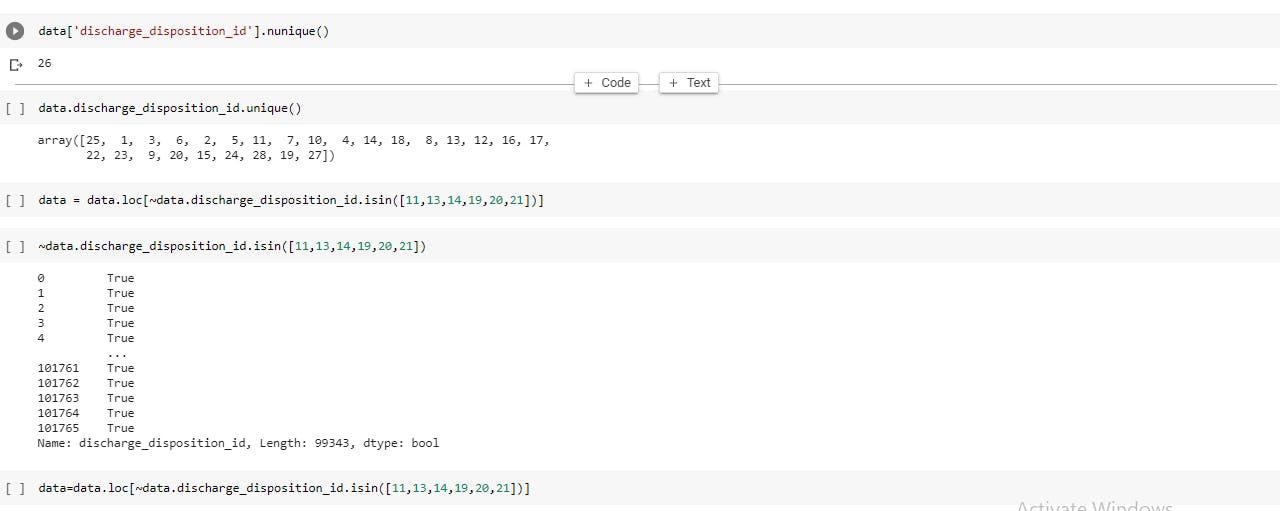
Here, I reduced the number of unique values of columns (discharge_disposition_id,admission_type_id,admission_source_id).
Here I removed those patients that died in the hospital since we are not predicting the death
I grouped the admission type into ["Emergency","Other", "Elective", "Newborn"] and I grouped the admission source into physician referral, emergency room, and transfer from a hospital
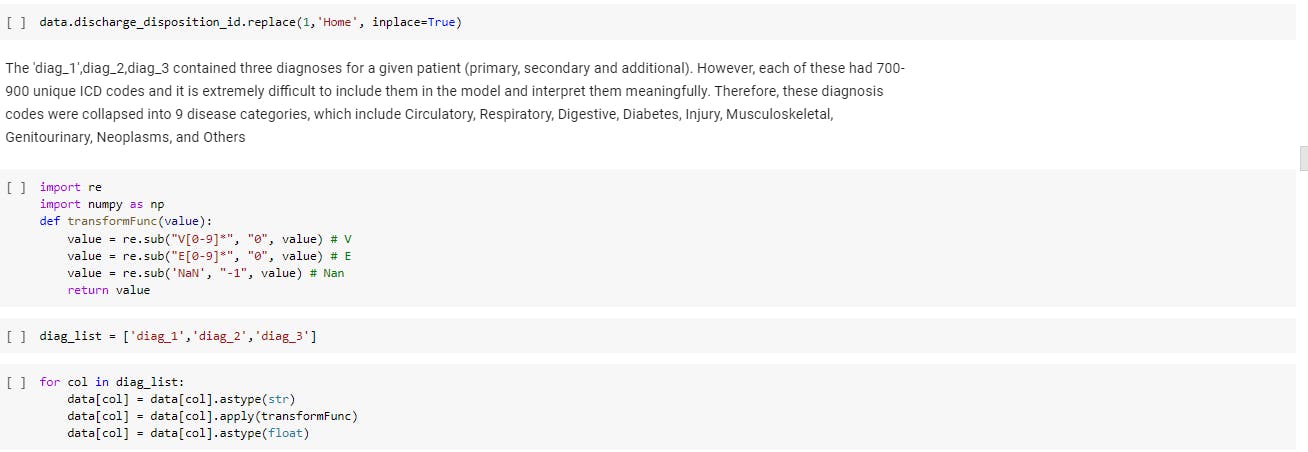
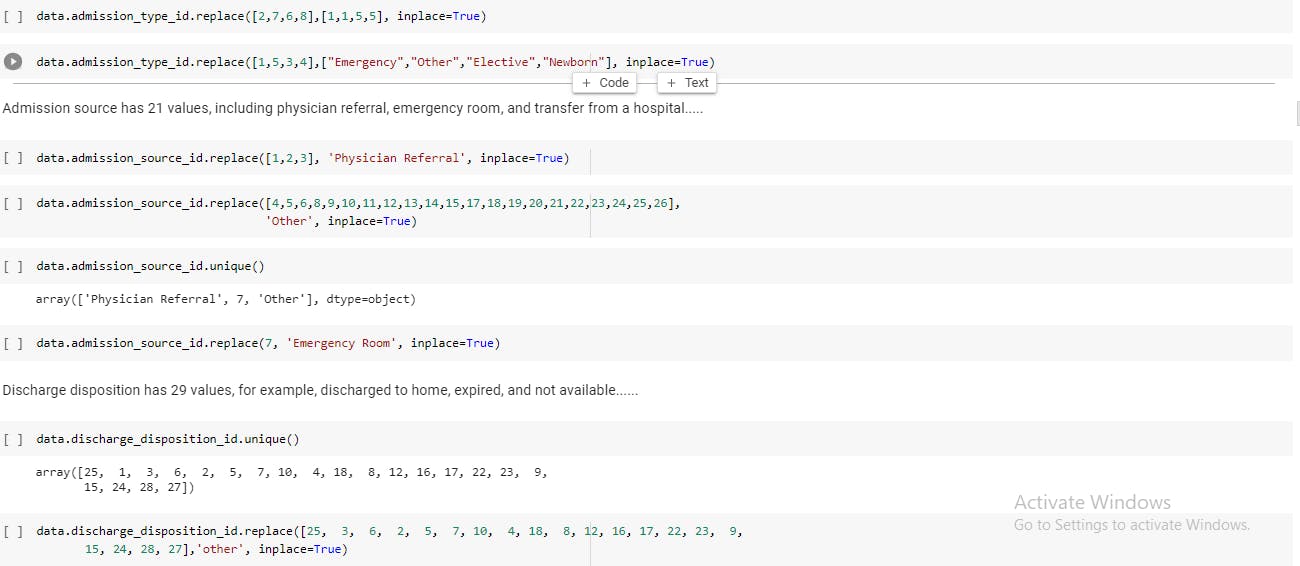 The 'diag_1',diag_2,diag_3 contained three diagnoses for a given patient (primary, secondary and additional). However, each of these had 700-900 unique ICD codes and it is extremely difficult to include them in the model and interpret them meaningfully. Therefore, these diagnosis codes were collapsed into 9 disease categories, which include Circulatory, Respiratory, Digestive, Diabetes, Injury, Musculoskeletal, Genitourinary, Neoplasms, and Others

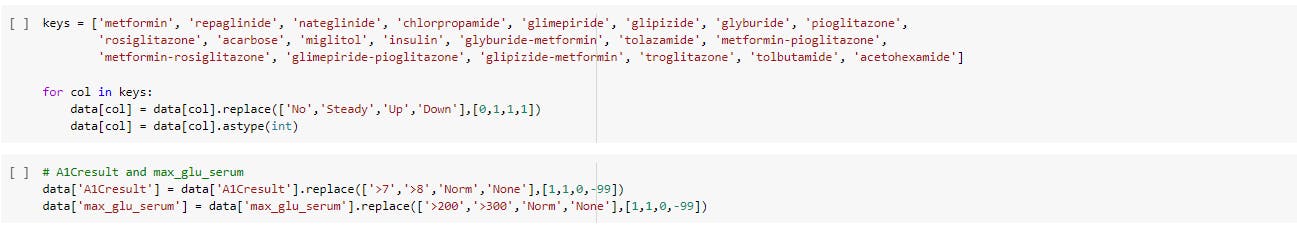
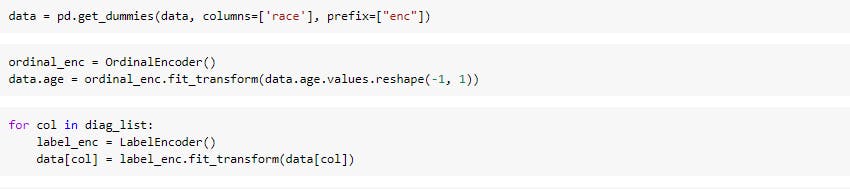
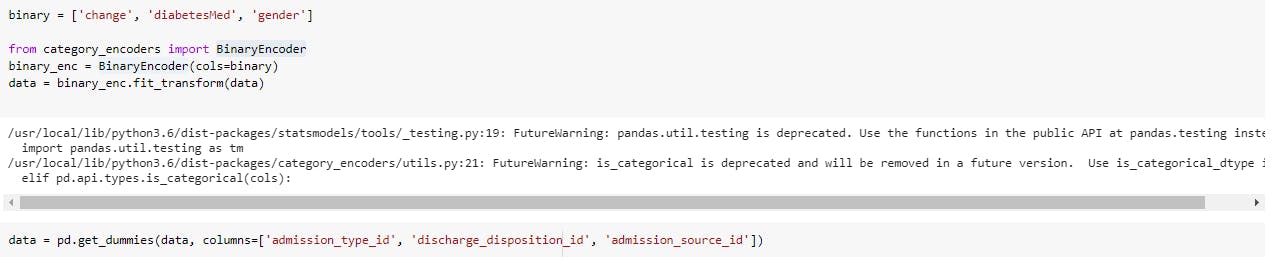
Model Building: Algorithms learn from data. They find relationships, develop understanding, make decisions, and evaluate their confidence from the training data they’re given. And the better the training data is, the better the model performs. In fact, the quality and quantity of your training data have as much to do with the success of your data project as the algorithms themselves. If you have categorical data, you can encode them. I used different encoding techniques like Label Encoder, One Hot Encoding(pandas get_dummies), Custom Binary Encoding to encode my categorical data.
I also split the data into train and test sets with a test size of 20%. I tried five different models and evaluated them using roc_auc_score, accuracy_score,recall_score,precision_score,f1_score. The five different models I tried are logistic regression, random forest classifier, XGboost classifier, light gradient boosting, and catboost.
Feature Importance: Oftentimes, apart from wanting to know what our price prediction is, we also wonder why it is what we got and which features are most important in determining the prediction.
Knowing feature importance indicated by machine learning models can benefit you in multiple ways, for example:
by getting a better understanding of the model’s logic you can not only verify it being correct but also work on improving the model by focusing only on the important variables
the above can be used for variable selection — you can remove x variables that are not that significant and have similar or better performance in much shorter training time
in some business cases it makes sense to sacrifice some accuracy for the sake of interpretability. For example, when a bank rejects a loan application, it must also have a reasoning behind the decision, which can also be presented to the customer.
In my program, I performed feature importance using light gradient boosting feature importance .
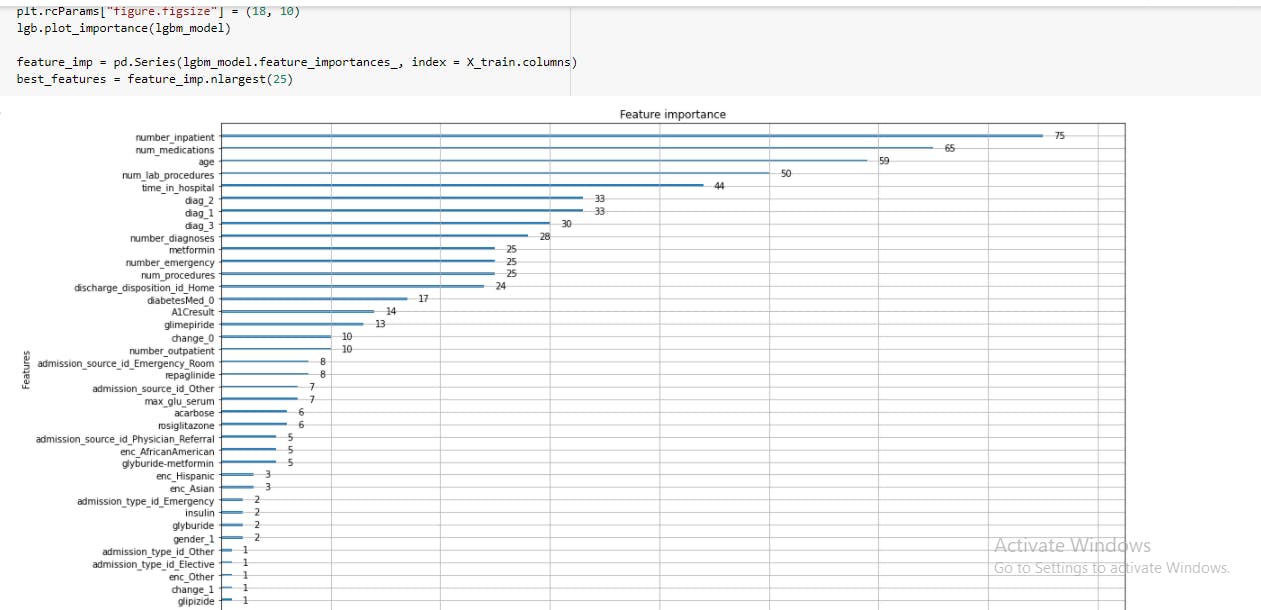 I choose the best 25 features.

Model Evaluation: Data scientists can evaluate the model in two ways: Hold-Out and Cross-Validation. In the Hold-Out method, the dataset is divided into three subsets: a training set, a validation set that is a subset that is used to assess the performance of the model built in the training phase, and a test set is a subset to test the likely future performance of a model. In most of the cases, the training:validation: test set ratios will be 3:1:1, which means 60% of the data to the training set, 20% of the data to the validation set, and 20% of the data to the test set.
I used the cross-validation in my model evaluation
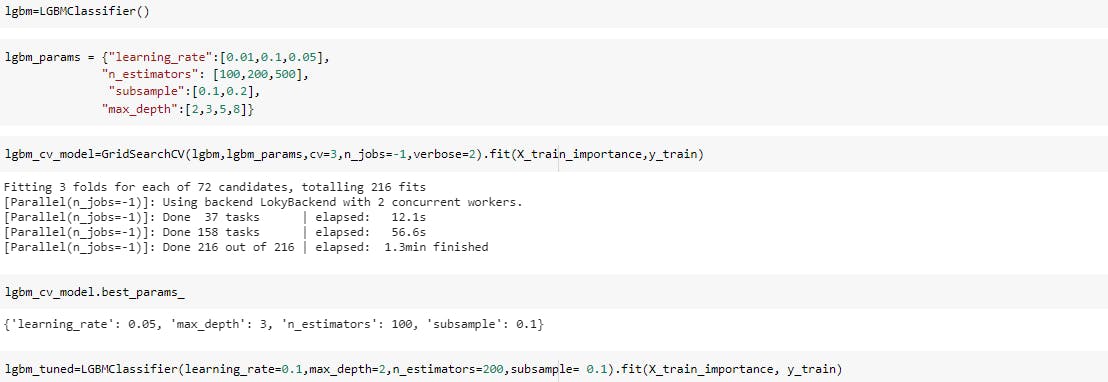
Light gbm
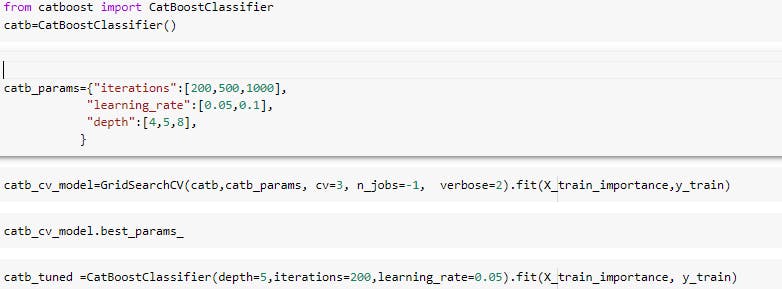
 Catboost
Comparing both models
8.Model Deployment: So I have created a basic webpage so that it’s simple to understand. Given the details of the patients, this model predicts if a patient will be readmitted.
I have deployed my Machine Learning model in scalingo.io using flask. I have trained the model using catboost algorithm but you can always train your model using any other Machine Learning model, or you can even use other ensemble models as they provide good accuracy.